
Data Confidence
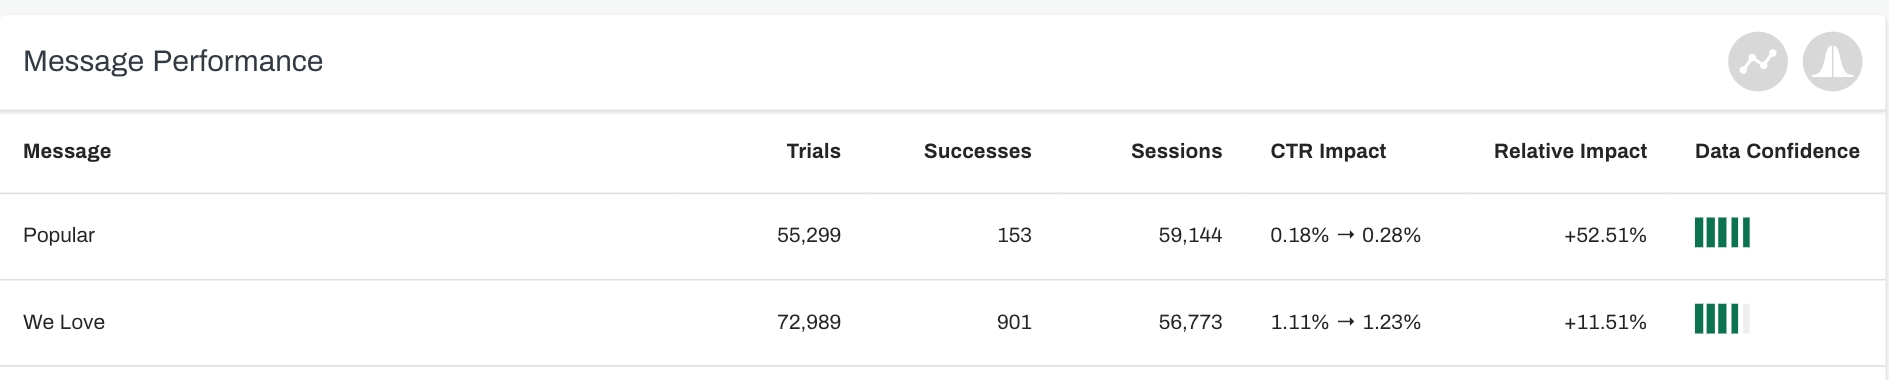
What is Data Confidence?
Data Confidence measures the trustworthiness of the results from our experiments. This is an important metric that determines the likelihood that the impact of your experiment is accurate and not caused by random chance. To test the data confidence yourselves, try the A/B Test Calculator.
The Data Confidence indicates how certain you can be that there is a significant impact of your test. This confidence is based on a combination of the amount of change (impact) and number of trials. So, if you have a very small measured impact, you need to run the test longer for more trials to get a significant result.
Our data bars go from red (not enough data to be trustworthy) to yellow (slightly trustworthy) to green (trustworthy). In general, the longer you run the test, the higher the Data Confidence. So, if your results are currently red, you should give the campaign more time to collect data or adjust the timeframe in which you are viewing the data.
However, AB test results can be difficult to read sometimes. For example:
A 10% measured impact with 95% confidence does not mean that you are 95% confident that you have a 10% change. It means that the change is big enough to be 95% confident that there is a significant change.
Because of some seasonal change or any other influence, the measured impact reverses (gets smaller) while your number of trials increases. In this case the significance can go down, and you need to keep the test running.
An unexpected event happened that influenced your measurements, in which case you should rerun the test.
You have so many trials, that even a minute measured impact of, for example, 0.02% is calculated with 100% confidence. The small impact is more likely to result from other unknown small effects than a causal connection of your test.
How do we measure Data Confidence?
We measure Data Confidence based on statistical significance using a null hypothesis test. This tests the difference between the performance of the Crobox group vs. Control group. In the Crobox group, users are exposed to our messages. In the Control group, users are exposed to invisible messages so that we can test the difference between the two.
The null hypothesis test determines whether or not the use of Crobox’s Campaigns has any impact on your KPIs.
There are two metrics of importance when determining statistical significance: P Value and Power. The P Value in your performance tracking is how we measure statistical significance. Power is the probability that a test of significance will pick up on an effect that is present.
A P Value of 0.05 (5%) means you can say with 95% confidence that there is a difference between the Crobox group vs. Control group. We always make sure our experiments have at least 95% statistical significance.
Last updated
Was this helpful?